

Shiba Inu price analysis for May 24, 2022, comes on a bearish note for the coin with increased chances of losing the $0.000010 price region if the selling pressure continues to dominate the price action for the meme coin. Additionally, we have also noted in our SHIB price analysis for May 23 that the bulls tried to push the meme coin through the $0.000013 price region but failed to do so as there is a strong resistance beyond $0.000012. At the time of writing, the token is more than 86% low than the all-time high and it seems that the situation won’t improve soon.


The data from CoinMarketCap shows that the trading volume for SHIB has surged 2.80% in the last 24 hours, while the market cap of the token has dropped by 5.61% in the same duration. Moreover, the Volume / Market Cap Ratio stands at a value of 0.08406, while the Market Dominance of the token dropped to 0.51%.
The daily candle for Shiba Inu opened at a price of $0.00001168 and reached a daily high of $0.00001196. Moreover, the daily low for the token stands at a price of $0.00001163. The price of 1 SHIB at the time of writing is $0.00001174.
Shiba Inu price analysis on the daily chart for May 24
Shiba Inu price analysis for May 24 will take into consideration the data from the indicators integrated into the daily chart below.
Advertisement

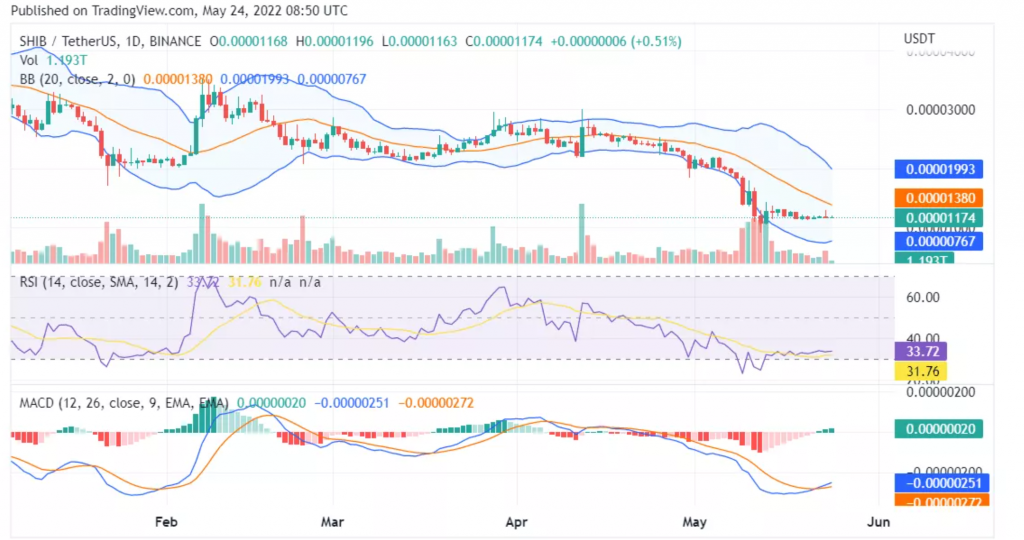
The RSI indicator reads a value below 34 which means that the bears are once again dominating the bulls.
The MACD indicator shows that the MACD line has broken above the signal line while the MACD histogram has turned green.
The SHIB price action is situated in the bearish zone of the Bollinger Bands, while a retest of the middle zone seems likely.
Conclusion
Shiba Inu price analysis for May 24, 2022, ends on a bearish note for the meme coin with considerable chances of retesting $0.000010.