


Solana price analysis for June 8, 2022, comes on a bullish note for the SOL token as we have seen a price surge of more than 3.7% in the last 24 hours. It is also important to note that the token has a major resistance beyond the $40 price level which was earlier a major support level for the token. As noted in our SOL price analysis for June 7, 2022, the token had found a support level at $40 which has now turned into a resistance. As long as prices hold near $40, we can expect SOL to reclaim the $40 price region.


The data from CoinMarketCap shows that the trading volume for SOL dropped by 17.29% in the last 24 hours, followed by a 3.47% surge in the market cap. The Market Dominance of the Solana token dropped to 1.07%, while the Volume / Market Cap Ratio stands at 0.1188.
Advertisement

The daily candle for Solana was initiated at a price of $39.32 and reached a daily high of $40.96. Furthermore, the daily low for SOL was seen at $38.28, while the price of 1 SOL at the time of writing was $39.21.
Solana price analysis from the daily chart for June 8
Solana price analysis for June 8, 2022, will take into account the data from the daily chart below and 3 major indicators integrated into it.
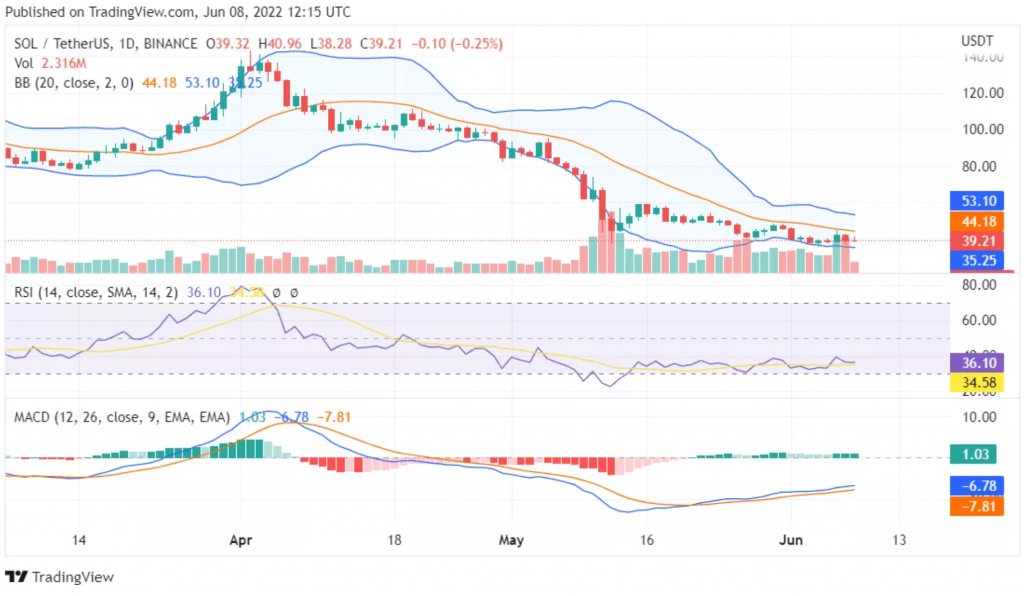
The MACD indicator shows that the MACD line is above the signal line but the two lines are now very close as chances of a bearish divergence increase.
The RSI indicator reads a value below 37 which means that the sellers are still in control while the gradient of the line suggests that lower prices are possible.
The price action for Solana is situated at the lower end of the Bollinger Bands and an increasingly volatile period might follow in the near future.
Conclusion
Solana price analysis for June 8, 2022, ends on a bullish note for SOL as the chances of breaking $40 remain considerably high.